The mood on Dutch Twitter
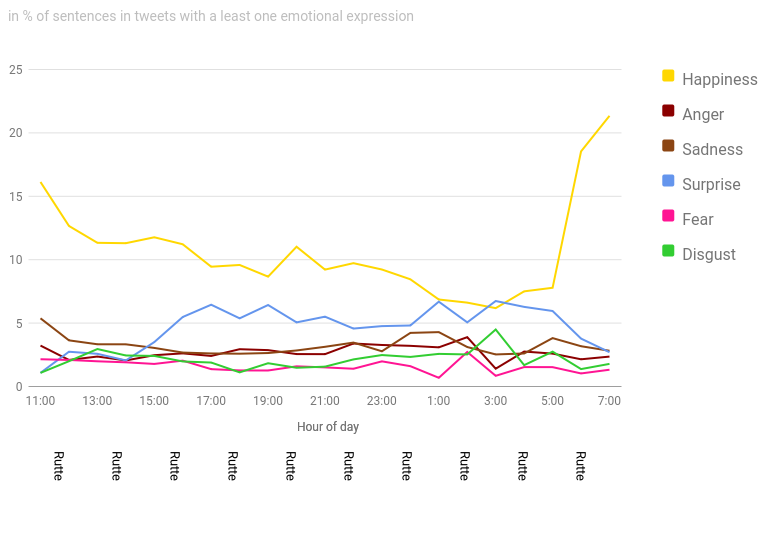
As part of a previous research, we used to sample and analyse a portion of Dutch Twitter traffic continuously. We registered top trends (the labels displayed under the horizontal axis) and dominant emotions. We only analysed the text in relation to hashtags and did not process any information pertaining to individual Twitter users.
Emotion detection was used to plot these charts. As we found out, expressions of happiness seem to signify the prevailing mood on Dutch Twitter. It starts to get more interesting when we zoom in on the trend which generated the most excitement for the past 24 hours. The pie chart below shows the relative distribution of emotions for this trend. The chart is redrawn every whole hour.
To further explore our data, we can lookup the trend which generated the most negative responses with a simple sort operation. The chart below is the result. The emotion ‘surprise’ is visible in the chart, but it is ignored when determining which trend to select, as it cannot be considered a negative or positive emotion.
Technical notes
The Twitter data was extracted from Twitter and stored using TCAT (Twitter Capture and Analysis Tool).
Copyright
Permission is granted to distribute the charts and information on this page, provided you link back to the original website.